
01
Executive overview
Key findings
176 million m3: water produced in FY 2023/24, up from 93.8 million m3 in FY 2013/14 (actual)
33.9%: non-revenue water across NWSC in FY 2023/24; 39.8% in the Kampala Water area (actual)
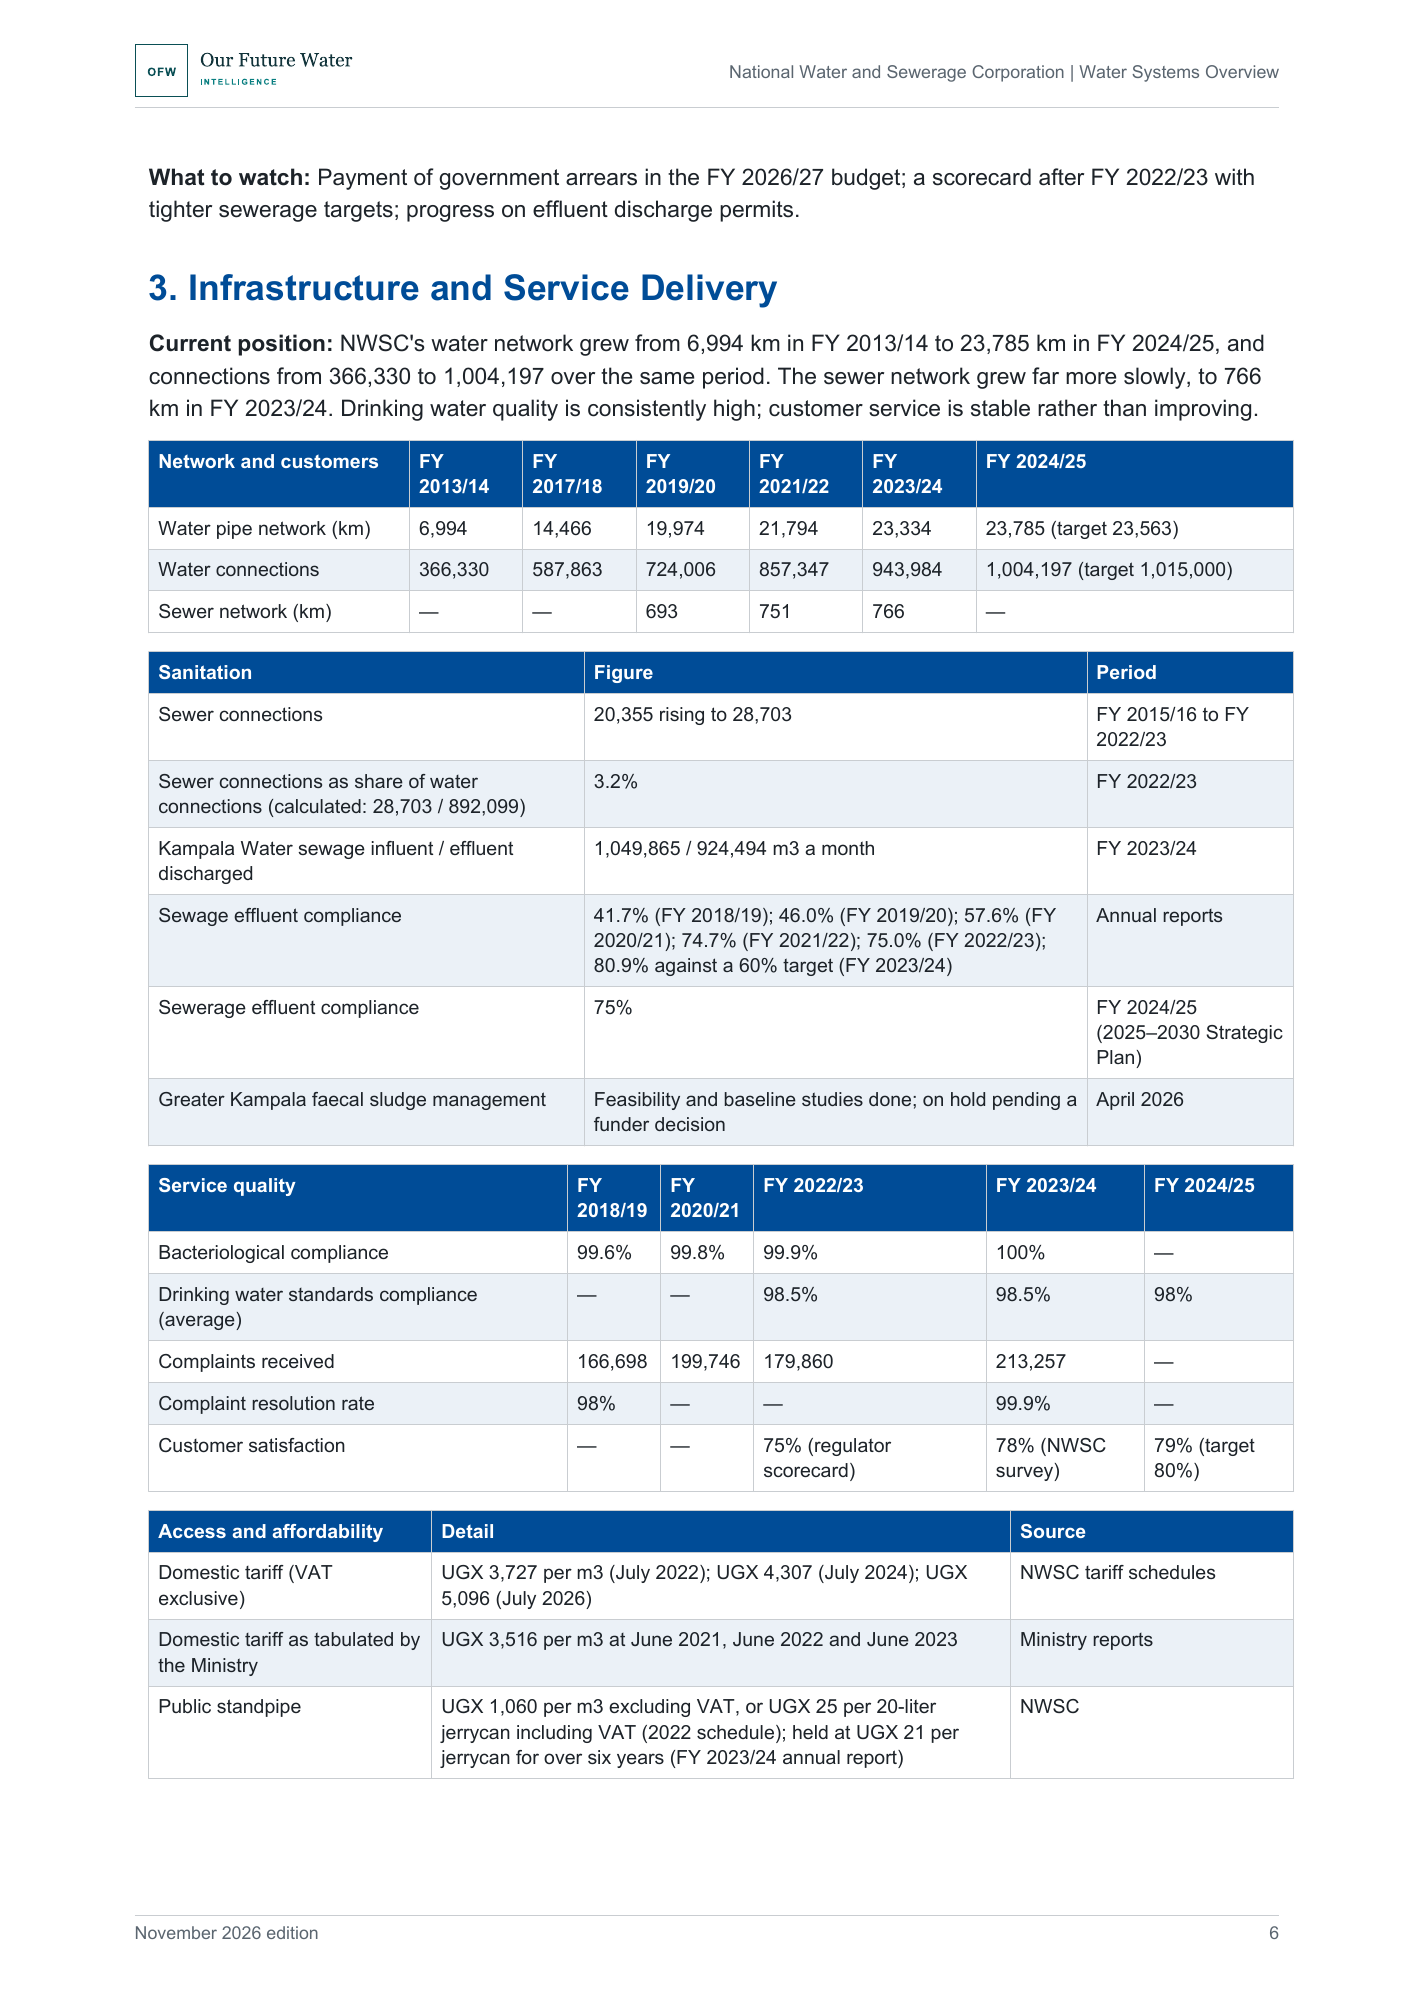
23,334 km: water pipe network against 766 km of sewers at 30 June 2024 (actual)
943,984: water connections in FY 2023/24, rising to 1,004,197 in FY 2024/25 (actual)
02
Buyer relevance
Who the report is for
Development partners planning Ugandan urban water and sanitation
See where Kampala, secondary-city and sanitation schemes stand, from Package 2B to the paused Greater Kampala faecal sludge project.
Sanitation and wastewater specialists
Use the sewer network, sewer connection and effluent compliance series alongside the Auditor General's permit findings.
Government and sector advisers
Compare the Ministry's coverage and scorecard figures with NWSC's own statements, side by side by date.
Loss-reduction and network contractors
Locate losses by area, with Kampala Water at 39.8% in FY 2023/24 against 20.5% to 25% elsewhere.
03
Decision scope
Questions answered
How much water does NWSC lose?
Non-revenue water was 33.9% in FY 2023/24; in FY 2022/23 about 57 million m3 of the 162 million m3 supplied was not sold.
How large is the sewer network compared with the water network?
766 km of sewers against 23,334 km of water mains at 30 June 2024; sewer connections were 3.2% of water connections in FY 2022/23.
Who oversees NWSC?
The Ministry of Water and Environment through performance contracts and a regulator scorecard; in FY 2022/23 the working ratio was 83% against an 80% target.
How many people does NWSC serve?
The Ministry estimated about 18 million in FY 2022/23; NWSC cited more than 22 million in August 2026; the 2030 target is 26 million.
04
Inside the report
Inside the complete report
Executive Overview
1. Water Resource Profile
2. Governance and Institutional Framework
3. Infrastructure and Service Delivery
Strategic Outlook and Opportunities
Source Register
05
Public preview
What to watch next
1. Water Resource Profile
Katosi output after the Package 2B network is connected in 2027; Kampala non-revenue water against the city's regulator target; completion of the Masaka intake.
2. Governance and Institutional Framework
Payment of government arrears in the FY 2026/27 budget; a scorecard after FY 2022/23 with tighter sewerage targets; progress on effluent discharge permits.
3. Infrastructure and Service Delivery
Sewer connections and effluent permits in the FY 2024/25 and FY 2025/26 annual reports; a funder decision on Greater Kampala faecal sludge management; SCAP 100 village coverage.
Strategic Outlook and Opportunities
Completion of Package 2B and Katosi output in 2027; a Government decision on the 50-town loan; AFD's decision on Mbarara; the audited FY 2024/25 accounts.
Section 3: network, sanitation, service quality and access tables for NWSC from FY 2013/14 to FY 2024/25.
06
Included
What you receive
The complete PDF report: 11 pages, 6 sections, 12 tables and a register of 25 sources.
This edition
November 2026, First edition.
07
Evidence & method
Evidence and method
NWSC annual reports and KPI tables from FY 2013/14 to FY 2023/24, its corporate and 2025–2030 strategic plans, tariff schedules and Customer Charter. Ministry of Water and Environment performance reports and regulator scorecard, the Auditor General's 2024 sewerage follow-up audit, and dated 2025–2026 reporting on projects and financing.
Sources
25 sources, listed in the report's source register. Evidence current to 3 November 2026. Principal data periods: FY 2013/14 to FY 2023/24 annual results (fiscal years end 30 June); FY 2024/25 performance from the 2025–2030 Strategic Plan; Ministry of Water and Environment scorecard for FY 2022/23; project status to September 2026. Currency is Uganda shillings (UGX) unless stated; euro amounts are given where the source states them..
Evidence boundaries
This report uses authoritative source material available at the stated research cutoff. It distinguishes published facts, calculated values and analytical interpretation. No independent modelling is performed. Forward-looking analysis reflects published plans, documented trends and stated uncertainties. It does not constitute legal, financial, investment or engineering advice.
08
Lead analyst
Robert C. Brears
Founder, Our Future Water Intelligence
Robert C. Brears is a water-security specialist and author whose work examines utility governance, infrastructure investment, climate resilience and long-term water-system change for executive and policy audiences.
- Decision-focused utility intelligence
- Published water-policy author
- Evidence-grounded system analysis
09
Buyer FAQs
Before you purchase
Who can use the report?
Licensed for internal use within one purchasing organization. The PDF and its contents may be shared with colleagues within that organization. External redistribution, resale and public publication are prohibited without permission.
How is the report delivered?
The PDF is available to download immediately after confirmed payment, through our secure delivery system.
Can my organization buy wider access?
Institutional purchasing: For invoice enquiries, multi-organization licensing or broader access requirements, contact Our Future Water Intelligence.
10
Water Systems Overview: National Water and Sewerage Corporation
- Format
- Length
- 11 pages
- Edition
- November 2026, First edition
- Price
- USD 499
11
Report details
Publication details
- Publisher
- Our Future Water Intelligence
- Report family
- Water Utility Intelligence Report
- Edition
- November 2026, First edition
- Format
- Length
- 11 pages
- Reference
- OFW_EXT_WATER_SYSTEMS_OVERVIEW_NATIONAL_WATER_AND_SEWERAGE_CORPORATION_8c2302670c2c
- Evidence current to
- 3 November 2026
14
Explore this report family
More Water Systems Overview reports
Explore the same report family covering other utilities.
Water Systems Overview: Aguas Andinas
- Geography
- Greater Santiago, Metropolitan Region, Chile
- Edition
- November 2026, corrected edition
- Length
- 11 pages
Water Systems Overview: Berliner Wasserbetriebe
- Geography
- Berliner Wasserbetriebe
- Edition
- October 2026, First edition
- Length
- 11 pages
Water Systems Overview: Department of Energy, Abu Dhabi Emirate
- Geography
- Department of Energy, Abu Dhabi Emirate
- Edition
- October 2026, First edition
- Length
- 14 pages