
01
Executive overview
Key findings
335,901 ML: water sourced for the Perth metropolitan system in FY 2025-26: 150,892 ML groundwater, 149,639 ML desalination and 33,164 ML net from surface water (actual)
40%: Perth hills dam storage on June 30, 2026 (228,903 ML of 566,688 ML capacity)
A$4,005.2 million: total revenue in FY 2025-26 (actual); the same summary reports an operating subsidy of A$668.2 million
62.8%: properties not affected by a water interruption longer than one hour in FY 2025-26, down from 75.5% in FY 2019-20
02
Buyer relevance
Who the report is for
Water infrastructure contractors and suppliers
See where the system needs work, from network renewal with leaks and bursts at 16.8 per 100 km to the Alkimos, Dampier and Nanarup desalination projects.
Investors and lenders in Australian infrastructure
Understand how Ministers set prices, approve transactions over A$25 million and decide dividends for a utility with A$4,005.2 million of revenue.
Water policy and planning advisers
Compare Perth's source mix, 44.9% groundwater and 9.9% surface water in FY 2025-26, with storage and inflow trends when assessing future sources.
Energy and technology providers
Gauge long-term demand from a desalination-heavy system and the 330 MW Marri wind purchase due from 2029, and the decision points on digital metering.
03
Decision scope
Questions answered
Where does Perth's water come from?
In FY 2025-26 Water Corporation sourced 150,892 ML from groundwater, 149,639 ML from desalination and 33,164 ML net from surface water, out of 335,901 ML in total.
How full are Perth's dams?
The Perth hills dams held 228,903 ML of 566,688 ML capacity on June 30, 2026, or 40%.
Who sets Water Corporation's prices?
The State Government sets prices through the State Budget; charges rose an average of 2.75% for 2026-27, below forecast inflation of 3.75%.
Is service reliability improving?
No. The share of properties not affected by an interruption longer than one hour fell from 75.5% in FY 2019-20 to 62.8% in FY 2025-26.
What did the regulator find?
The Economic Regulation Authority's 2025 asset management review found 10 deficiencies, seven linked to resource constraints, and requires an action plan before its next review in 2028.
04
Inside the report
Inside the complete report
Executive Overview
1. Water Resource Profile
2. Governance and Institutional Framework
3. Infrastructure and Service Delivery
Strategic Outlook and Opportunities
Source Register
05
Public preview
What to watch next
1. Water Resource Profile
Dam storage after the 2026-27 summer; groundwater allocation decisions for Gnangara; the share of desalination once Alkimos begins supplying.
2. Governance and Institutional Framework
The FY 2026-27 Statement of Corporate Intent; the new Minister's pricing and dividend decisions; ERA reporting on action plan progress before the 2028 review.
3. Infrastructure and Service Delivery
Interruption and main break rates in FY 2026-27; wastewater overflow events; safe-water access in Aboriginal communities against the 80% target.
Strategic Outlook and Opportunities
The Securing City's Water Supply decision and its financing model; Alkimos commissioning toward mid-2028; the Lower Great Southern plant decision; FY 2026-27 interruption and main break rates.
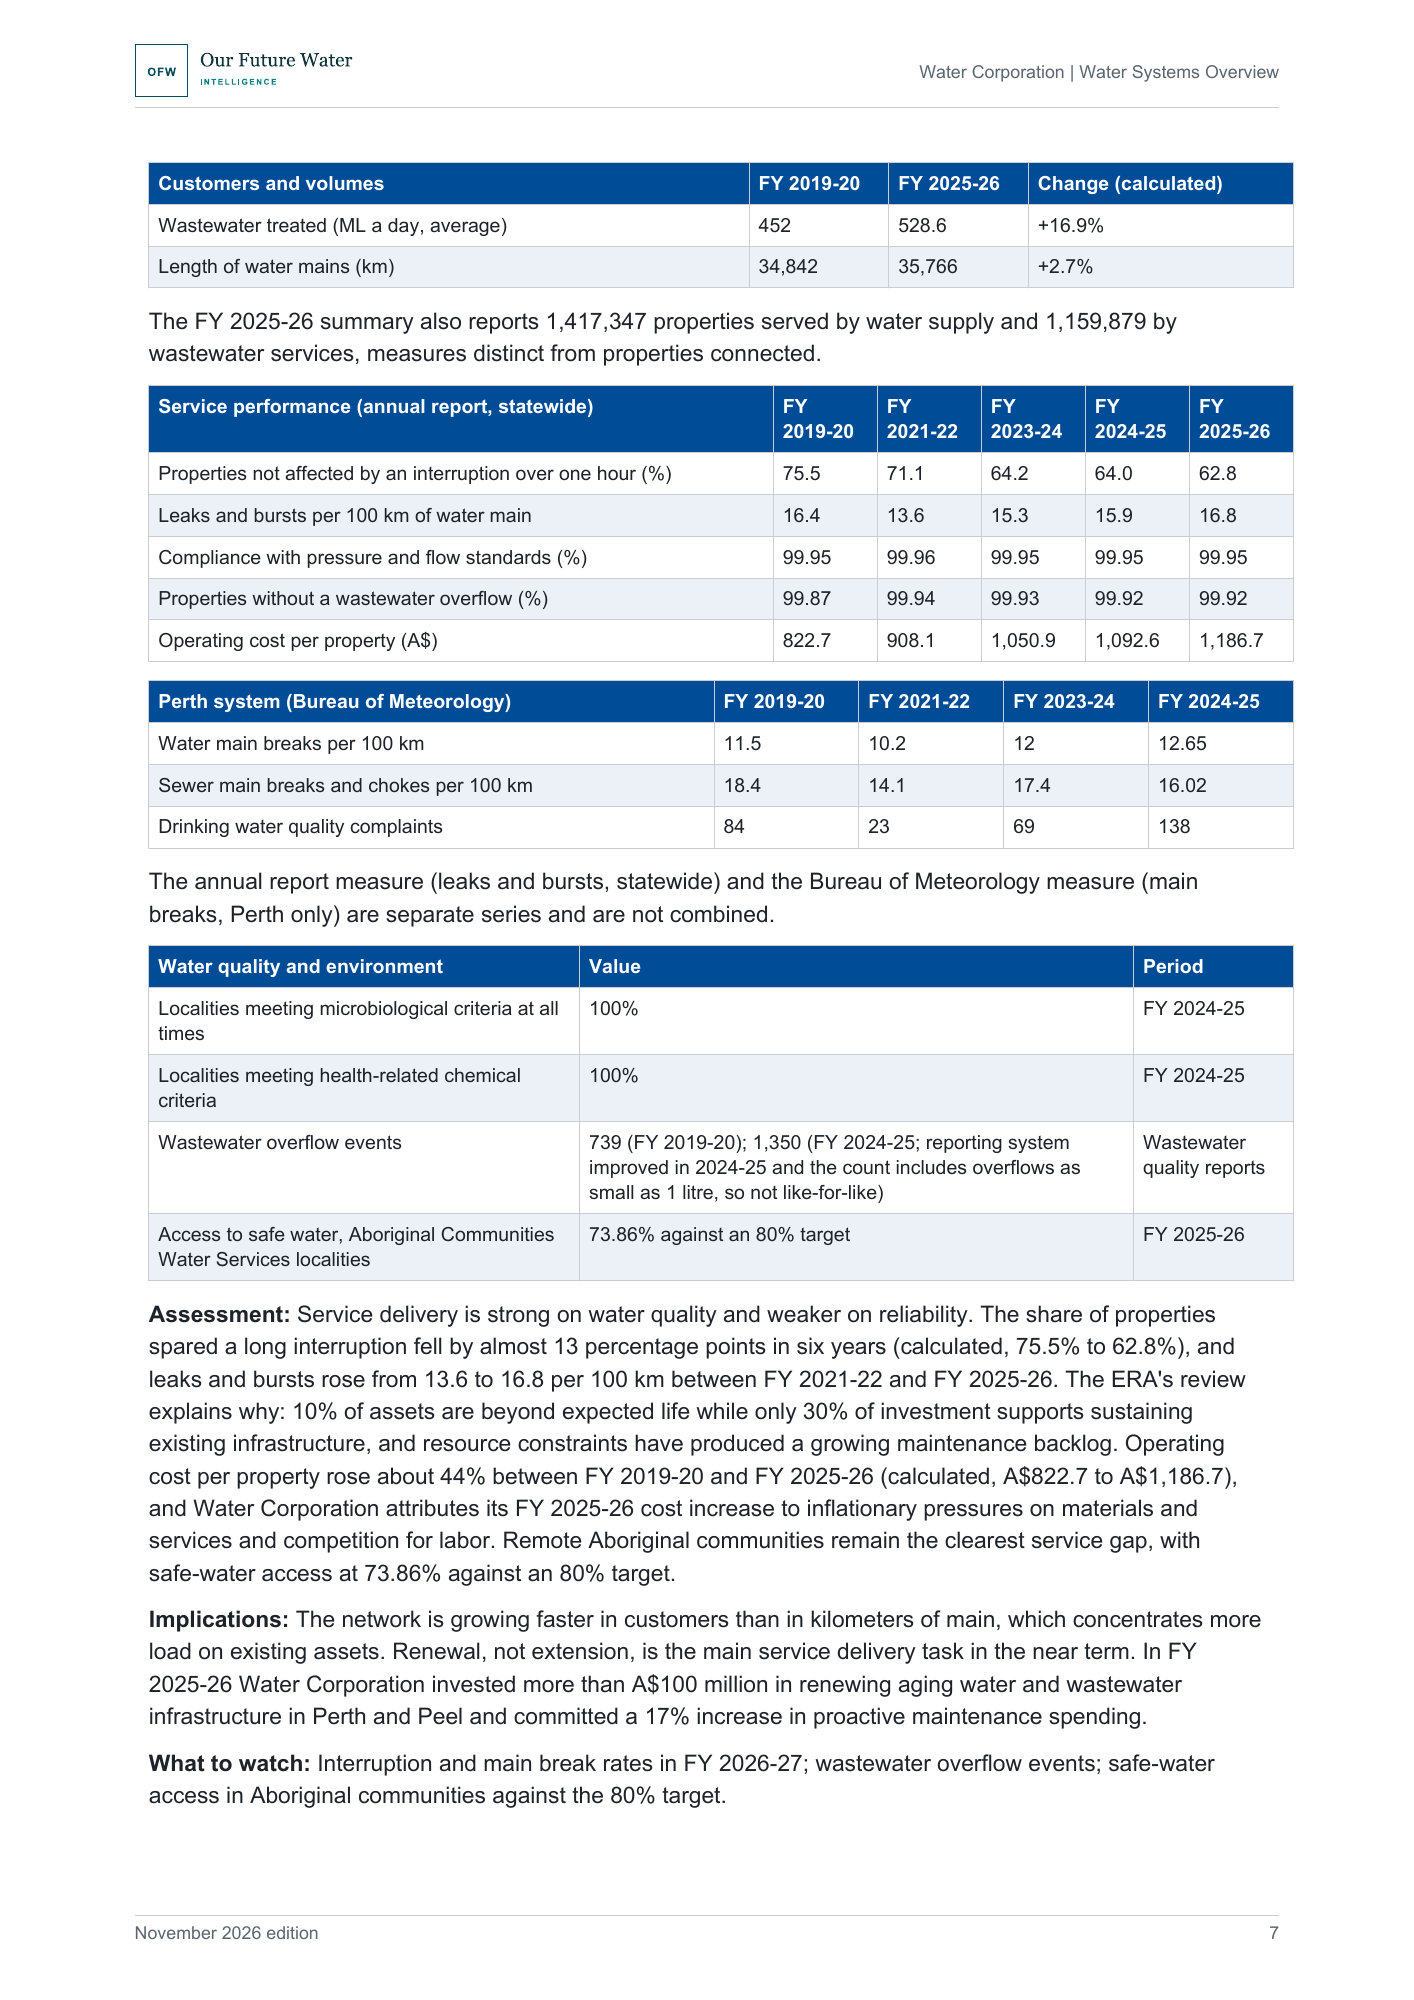
Infrastructure and service delivery: service performance, Perth system indicators and water quality results.
06
Included
What you receive
The complete PDF report: 11 pages, 6 sections, 14 tables and a register of 19 sources.
This edition
November 2026, First edition.
07
Evidence & method
Evidence and method
The report draws on Water Corporation's audited Annual Report 2026, including its metropolitan sources of supply and five-year statistical summary, earlier annual reports and water and wastewater quality reports. It also uses Economic Regulation Authority licence reviews and audits, Bureau of Meteorology national performance data, and Western Australian Government budget and policy statements checked on November 2, 2026.
Sources
19 sources, listed in the report's source register. Evidence current to 2 November 2026. Principal data periods: FY 2025-26 audited annual report (year ended June 30, 2026) and its five-year statistical summary; Bureau of Meteorology national performance data for the Perth system to FY 2024-25; regulator reviews published in 2024 and 2026; dam storage at June 30, 2026; project and policy status checked on November 2, 2026. All currency is Australian dollars (A$)..
Evidence boundaries
This report uses authoritative source material available at the stated research cutoff. It distinguishes published facts, calculated values and analytical interpretation. No independent modelling is performed. Forward-looking analysis reflects published plans, documented trends and stated uncertainties. It does not constitute legal, financial, investment or engineering advice.
08
Lead analyst
Robert C. Brears
Founder, Our Future Water Intelligence
Robert C. Brears is a water-security specialist and author whose work examines utility governance, infrastructure investment, climate resilience and long-term water-system change for executive and policy audiences.
- Decision-focused utility intelligence
- Published water-policy author
- Evidence-grounded system analysis
09
Buyer FAQs
Before you purchase
Who can use the report?
Licensed for internal use within one purchasing organization. The PDF and its contents may be shared with colleagues within that organization. External redistribution, resale and public publication are prohibited without permission.
How is the report delivered?
The PDF is available to download immediately after confirmed payment, through our secure delivery system.
Can my organization buy wider access?
Institutional purchasing: For invoice enquiries, multi-organization licensing or broader access requirements, contact Our Future Water Intelligence.
10
Water Systems Overview: Water Corporation
- Format
- Length
- 11 pages
- Edition
- November 2026, First edition
- Price
- USD 499
11
Report details
Publication details
- Publisher
- Our Future Water Intelligence
- Report family
- Water Utility Intelligence Report
- Edition
- November 2026, First edition
- Format
- Length
- 11 pages
- Reference
- OFW_EXT_WATER_SYSTEMS_OVERVIEW_WATER_CORPORATION_4195c439f418
- Evidence current to
- 2 November 2026
14
Explore this report family
More Water Systems Overview reports
Explore the same report family covering other utilities.
Water Systems Overview: Berliner Wasserbetriebe
- Geography
- Berliner Wasserbetriebe
- Edition
- October 2026, First edition
- Length
- 11 pages
Water Systems Overview: Department of Energy, Abu Dhabi Emirate
- Geography
- Department of Energy, Abu Dhabi Emirate
- Edition
- October 2026, First edition
- Length
- 14 pages
Water Systems Overview: Sydney Water
- Geography
- Sydney Water
- Edition
- October 2026, First edition
- Length
- 13 pages