
01
Executive overview
Key findings
325,000 acre-feet a year: firm Colorado River and Highland Lakes supply, against a peak annual diversion of 174,781 acre-feet in 2022 (Drought Contingency Plan 2024)
US$1.5 billion: Walnut Creek Wastewater Treatment Plant expansion from 75 MGD to 100 MGD; construction began in April 2026
US$3.2 billion: five-year capital improvement plan for FY 2027–2031 in the 2026-27 budget, up from US$2.7 billion
7.1 billion gallons: water lost in 2023 (City Auditor estimate); the Infrastructure Leak Index was 4.18 in 2023, and Austin Water's water quality reports page gives 5.44 for 2024 and 5.16 for 2025, above the 3 to 5 range it describes as appropriate (goal 3.0 by 2040)
02
Buyer relevance
Who the report is for
Engineering and construction firms
Use the major project table, from the US$1.5 billion Walnut Creek expansion to the US$125.58 million Williamson Creek tunnel, to see where wastewater and pipe work is concentrated.
Water resource planners
Set the 2024 plan's 44,500 acre-feet a year from aquifer storage and recovery against a field-testing timeline that runs to a Phase 1B report in spring 2028.
Municipal credit analysts
Weigh Moody's July 2026 upgrade to Aa1 against a forecast 29.9% cumulative bill increase and a 23.2% cash-funding share of the FY 2027 capital plan.
Leak detection and asset management providers
Compare a break rate of 9.2 per 100 miles with a leak index that rose from 3.86 in 2021 to 4.18 in 2023.
03
Decision scope
Questions answered
How much of its firm supply does Austin Water use?
Its five-year average diversion of about 164,409 acre-feet a year is 50.6% of the 325,000 acre-feet firm supply (calculated); the 2022 peak was 174,781 acre-feet.
Who decides Austin Water's budget and rates?
The Austin City Council, which adopted the FY 2026-27 Austin Water budget on August 12, 2026, with rates effective October 1, 2026.
How is the Walnut Creek expansion financed?
Through a US$59 million state revolving fund loan closed in May 2026, up to US$50 million of Series 2026 bond proceeds, Austin Water funds and a WIFIA loan of up to US$1 billion still listed as 'Applied' on October 13, 2026.
How much water does Austin lose?
An estimated 7.1 billion gallons in 2023, up from 6.5 billion in 2021, according to the City Auditor; the leak index goal is 3.0 by 2040.
04
Inside the report
Inside the complete report
Executive Overview
1. Water Resource Profile
2. Governance and Institutional Framework
3. Infrastructure and Service Delivery
Strategic Outlook and Opportunities
Source Register
05
Public preview
What to watch next
Strategic Outlook and Opportunities
The FY 2027-28 proposed budget in summer 2027 and whether the planned 6.7% system-wide rate increase for FY 2028 holds; closing of the WIFIA loan for Walnut Creek, still listed as "Applied" on October 13, 2026; the next S&P and Fitch reviews; Walnut Creek against its 2031 service date, Williamson Creek tunnelling and Fallwell Lane substantial completion around April 2027; the aquifer storage and recovery test wells in spring 2027 and the Phase 1B report in spring 2028.
2. Governance and Institutional Framework
The FY 2027-28 budget cycle in summer 2027; any change in S&P or Fitch ratings after the Moody's upgrade; the 2026 water quality report and the next compliance quarters.
1. Water Resource Profile
The eastern Travis County site decision in fall 2026 and the spring 2027 test wells; the Phase 1B report in spring 2028; Highland Lakes storage against the 1.4 million acre-feet Stage 1 trigger; the next five-year update of the Drought Contingency Plan.
3. Infrastructure and Service Delivery
The 2024 and 2025 water loss audits submitted to the Texas Water Development Board; delivery of the US$18 million service line program; asset-condition and leak-response measures in the next budget; progress at Walnut Creek against its 2031 service date.
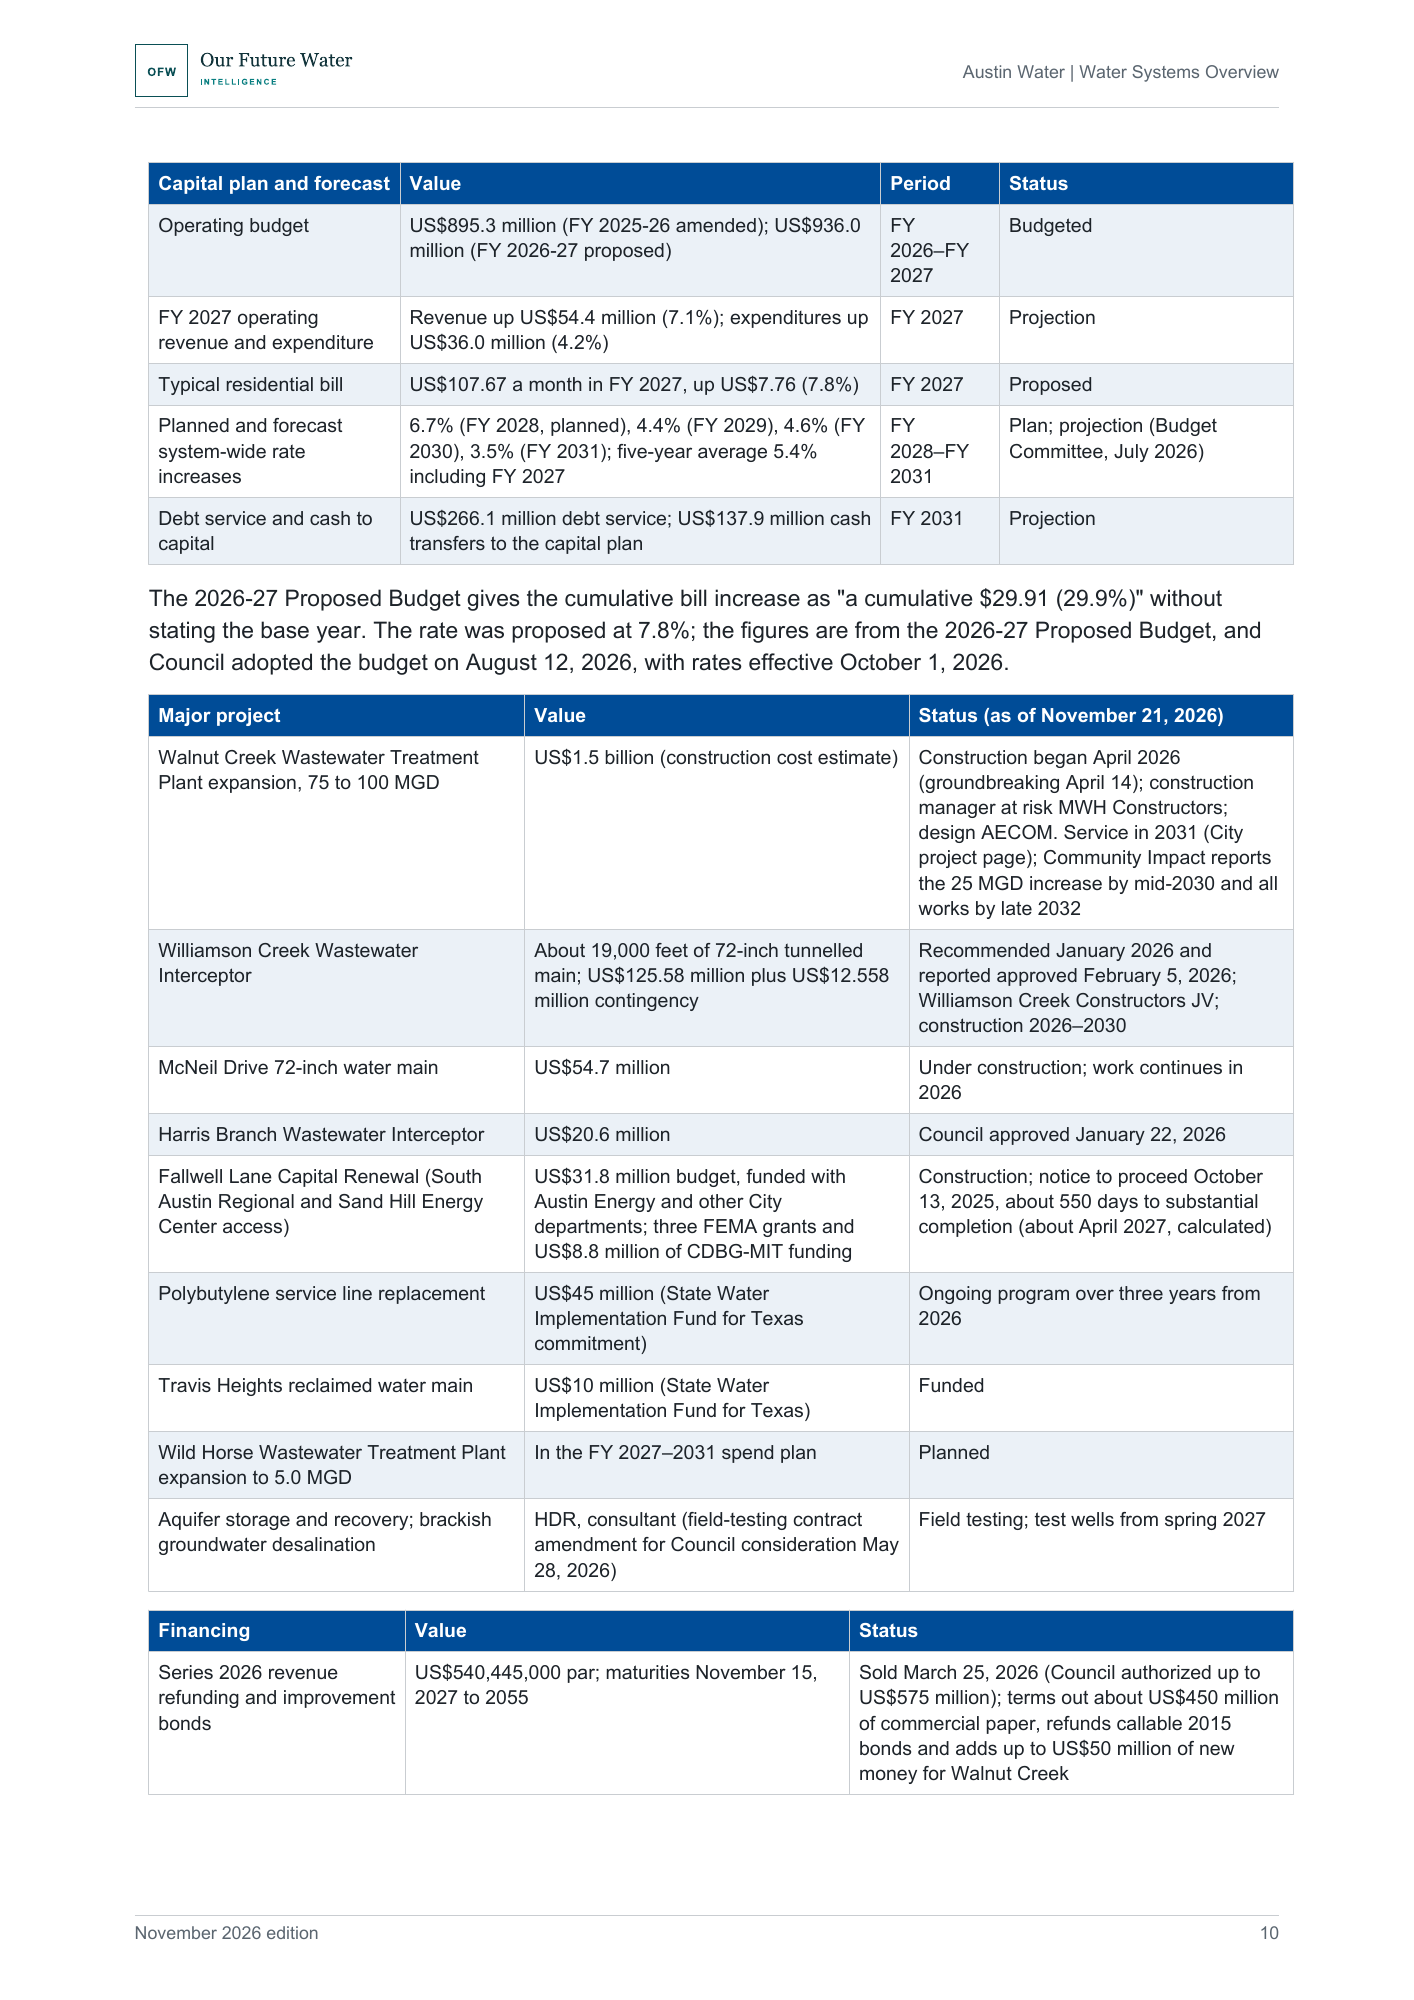
Major projects with value and status as of November 21, 2026, and the financing table, from the Strategic Outlook.
06
Included
What you receive
The complete PDF report: 14 pages, 6 sections, 13 tables and a register of 25 sources.
This edition
November 2026, First edition.
07
Evidence & method
Evidence and method
Austin Water's Water Forward 2024 plan, Drought Contingency Plan and annual water quality reports; the City's FY 2024 financial report, 2026-27 budget and bond official statements; City Auditor reports, EPA compliance and loan records, and 2025-2026 Council and Water & Wastewater Commission documents.
Sources
25 sources, listed in the report's source register. Evidence current to 21 November 2026. Principal data periods: FY 2024 audited results (fiscal year ended September 30, 2024); FY 2019–FY 2023 system statistics (Series 2024 Official Statement); FY 2026-27 budget and FY 2027–2031 forecast; Water Forward 2024; drinking water compliance to June 30, 2026; project and financing status checked to November 21, 2026. All currency is US dollars.
Evidence boundaries
This report uses authoritative source material available at the stated research cutoff. It distinguishes published facts, calculated values and analytical interpretation. No independent modelling is performed. Forward-looking analysis reflects published plans, documented trends and stated uncertainties. It does not constitute legal, financial, investment or engineering advice.
08
Lead analyst
Robert C. Brears
Founder, Our Future Water Intelligence
Robert C. Brears is a water-security specialist and author whose work examines utility governance, infrastructure investment, climate resilience and long-term water-system change for executive and policy audiences.
- Decision-focused utility intelligence
- Published water-policy author
- Evidence-grounded system analysis
09
Buyer FAQs
Before you purchase
Who can use the report?
Licensed for internal use within one purchasing organization. The PDF and its contents may be shared with colleagues within that organization. External redistribution, resale and public publication are prohibited without permission.
How is the report delivered?
The PDF is available to download immediately after confirmed payment, through our secure delivery system.
Can my organization buy wider access?
Institutional purchasing: For invoice enquiries, multi-organization licensing or broader access requirements, contact Our Future Water Intelligence.
10
Water Systems Overview: Austin Water
- Format
- Length
- 14 pages
- Edition
- November 2026, First edition
- Price
- USD 499
11
Report details
Publication details
- Publisher
- Our Future Water Intelligence
- Report family
- Water Utility Intelligence Report
- Edition
- November 2026, First edition
- Format
- Length
- 14 pages
- Reference
- OFW_EXT_WATER_SYSTEMS_OVERVIEW_AUSTIN_WATER_4ca67d4b5800
- Evidence current to
- 21 November 2026
14
Explore this report family
More Water Systems Overview reports
Explore the same report family covering other utilities.
Water Systems Overview: Thames Water
- Geography
- London and the Thames Valley, England
- Edition
- November 2026 edition
- Length
- 15 pages
Water Systems Overview: Denver Water
- Geography
- Denver and surrounding suburbs, Colorado, United States
- Edition
- November 2026, First edition
- Length
- 14 pages
Water Systems Overview: San Diego County Water Authority
- Geography
- San Diego County, California, United States
- Edition
- November 2026, First edition
- Length
- 15 pages